Table of Contents >> Show >> Hide
For decades, the humble 60/40 portfolio 60% stocks, 40% bonds has been the
go-to “set it and (mostly) forget it” strategy for regular investors. It’s the financial
equivalent of a sensible sedan: not flashy, not the fastest, but gets you where you need to go
most of the time without drama.
And then a year like 2022 shows up, kicks the tires off your balanced portfolio,
and makes you wonder if the whole idea of diversification was just a very long, very elaborate
prank.
The good news? Even the worst years for a 60/40 portfolio fit into a bigger story that’s
actually pretty reassuring. The bad news? You have to live through the bad years in real time,
which never feels reassuring at all.
What Exactly Is a 60/40 Portfolio?
At its core, a 60/40 portfolio simply allocates about 60% of your money to
equities (usually broad stock indexes) and 40% to
bonds or other fixed income. It’s designed to balance growth (stocks) and
stability plus income (bonds). Financial firms from Fidelity and BlackRock to independent
advisors describe it as the classic “balanced portfolio” starting point for
long-term investors, tweaked based on age, risk tolerance, and goals.
Historically, this mix has done surprisingly well. Research from academic-style and industry
studies finds that a 60/40 portfolio has delivered:
- Roughly 5–6% real (after-inflation) annual returns over very long periods,
- Nominal returns around the high single digits (close to 9–10% in some U.S.-focused samples),
- Positive returns in the vast majority of rolling five-year periods more than 90% of the time in some analyses.
In other words, the 60/40 portfolio is built to be boring and boring has historically been
quite profitable. But that doesn’t mean it never has terrible years. It does. Let’s visit a few
of the worst ones.
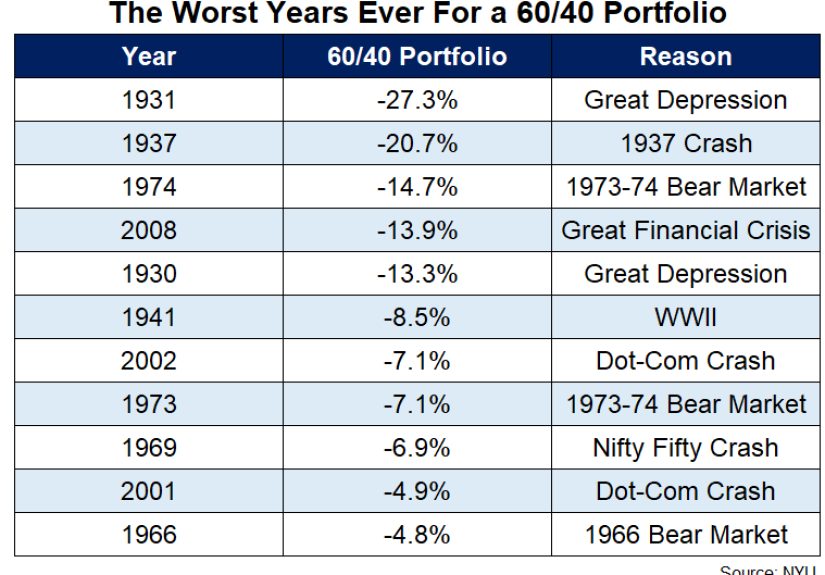
The Truly Bad Years for a 60/40 Portfolio
When people talk about the “worst years ever” for a 60/40 portfolio, they are usually looking at
annual returns for a U.S. portfolio made up of:
- 60% in something like the S&P 500, and
- 40% in intermediate or 10-year U.S. Treasuries.
Using this setup, researchers and market historians have highlighted a handful of years that
stand out for how painful they were even with diversification.
1. 1931: The Great Depression Gut Punch
The early 1930s were brutal for almost any portfolio, and the 60/40 was no exception. During the
depths of the Great Depression, stocks crashed, unemployment soared, and the
banking system wobbled. In 1931, some historical reconstructions estimate a 60/40 portfolio
lost roughly 26–27% in a single year, one of the worst calendar-year returns on
record for a balanced strategy.
For perspective, an all-stock portfolio did even worse losing more than 40% that year but
losing over a quarter of your life savings still hurts, even if your neighbor is down almost
half.
2. 1937: Another Depression-Era Blow
Just when investors thought they’d survived the worst, the late-1930s brought another nasty
downturn. Historical estimates show a 60/40 portfolio losing over 20% in 1937,
again during a period dominated by economic uncertainty and policy mistakes.
The lesson from the 1930s: even “balanced” portfolios are not magic shields. When the entire
economic and financial system is under massive stress, volatility finds everyone.
3. The 1970s: Stagflation, Oil Shocks, and Real Returns Pain
The 1970s were a slow burn rather than a sudden crash. Stocks struggled; inflation soared;
interest rates climbed; and investors discovered that “safe” bonds could still make them feel
pretty miserable in real terms.
The mid-1970s, especially around 1973–1974, saw sharp equity declines during
the oil crisis and stagflation shock. Some analyses show the worst rolling 12-month period for a
60/40 portfolio around this era as one of the top historical drawdowns outside the Great
Depression.
On paper, the 60/40 did its job by falling less than an all-stock portfolio. But with inflation
roaring, even modest nominal losses felt like real devastation a reminder that inflation can
erode “conservative” portfolios just as effectively as a stock crash.
4. 2008: The Global Financial Crisis
Fast forward to 2008. The housing market imploded, major banks teetered, and
the global financial system came close to seizure. For diversified investors, this was another
generational stress test.
According to data cited by Ben Carlson on A Wealth of Common Sense, a 60/40 portfolio
in 2008 saw losses on par with some of the historically bad years not as awful as 1931, but
still deeply negative.
The difference? Bonds largely did what they were supposed to do. Treasuries rallied as investors
fled to safety, cushioning the blow from crashing stocks. The 60/40 still got punched, but it
didn’t get completely knocked out.
5. 2022: When Both Stocks and Bonds Fell Together
And then came 2022, a year that will be seared into the memories of anyone who
thought “balanced portfolio” meant “emotionally safe forever.”
In 2022:
- U.S. stocks fell sharply as the Federal Reserve hiked interest rates at one of the fastest paces in modern history, and
- Bonds suffered one of their worst years ever as yields spiked and prices plunged.
A 60/40 portfolio of U.S. stocks and bonds lost around 18% for the year, the
worst performance for this strategy since at least the late 1930s in some datasets, and one of
the three worst years in modern history.
Vanguard estimates that a global 60/40 portfolio spread across world stocks
and bonds fell about 16% in 2022. Even Morningstar’s
150-year “stress test” of the strategy concluded that 2022 was uniquely painful because it took
the worst bond market in history to make a diversified 60/40 more uncomfortable during a crash
than going all in on equities.
Ben Carlson’s follow-up data shows how weird (and short-lived) that pain looks in context:
- 2022: one of the worst years ever for a 60/40 portfolio,
- 2023: roughly +17% for the same 60/40 mix,
- 2024: another gain of about +14%.
Translation: the year that “killed” the 60/40 was immediately followed by two very solid years
a textbook example of why long-term investors can’t just extrapolate one bad year into a
permanent trend.
Why the Worst Years Happen
If the 60/40 portfolio is supposed to be diversified, why do some years still look so ugly?
Several themes show up again and again in the worst periods:
1. Stocks and Bonds Falling Together
The classic 60/40 formula quietly assumes that stocks and bonds are often
negatively correlated: when stocks fall, high-quality bonds usually hold up or
even rally. That pattern held in many past crises, including 2000–2002 and 2008.
But in 2022, rising inflation and aggressive rate hikes flipped that relationship. Both stocks
and bonds declined together for an unusually long stretch, something State Street and others
have flagged as a serious but rare challenge for traditional balanced portfolios.
2. Inflation and Interest Rate Shocks
Many of the worst 60/40 years share a common villain: inflation.
- In the 1970s, inflation eroded real returns and forced higher rates.
- In 2022, inflation again surged, prompting central banks to hike interest rates rapidly.
When interest rates rise sharply, bond prices fall. When those rate hikes also slow the economy,
stocks struggle too. That one-two punch is the nightmare scenario for a 60/40 portfolio. Morgan
Stanley has pointed out that this kind of macro backdrop slowing growth plus rising inflation
is exactly when the 60/40 faces its toughest test.
3. Extreme Valuations Before the Fall
Another recurring pattern: bad years often follow periods when either stocks or bonds (or both)
are priced for perfection. When valuations are stretched and yields are very low, future returns
become more fragile. Morningstar’s long-run analysis and GMO’s work on 60/40 real returns both
suggest that starting valuations matter a lot, even if the strategy still earns reasonable
returns over many decades.
Is the 60/40 Portfolio Dead?
After 2022, headlines screamed that the beloved 60/40 portfolio was “broken” or “dead.” A number
of commentaries from Investopedia-style explainers to institutional whitepapers questioned
whether a simple stocks-and-bonds mix was still enough in a world of higher inflation, more
volatility, and lower expected returns.
But history and recent performance tell a more nuanced story:
- A Wealth of Common Sense showed that 2022 was indeed one of the worst years ever
for 60/40 but also that the strategy has a long track record of bouncing back strongly after bad
drawdowns. - Morningstar’s 150-year stress test concludes that, even after the recent rough patch, 60/40 still
looks robust over long horizons, especially compared with holding only stocks during deep crashes. - By 2023 and 2024, balanced funds had staged a significant comeback, with some prominent 60/40-style
mutual funds and ETFs delivering strong double-digit gains, as reported by outlets like Barron’s.
Large asset managers like BlackRock now frame the 60/40 less as a rigid rule and more as a
starting template one that can be enhanced with inflation-sensitive assets
(like TIPS, commodities, or real assets) and potentially alternatives, rather than abandoned
altogether.
So, no, the 60/40 portfolio isn’t dead. It’s just been reminded that it lives in the real world,
not in a spreadsheet.
Practical Lessons from the Worst 60/40 Years
The worst years for a 60/40 portfolio aren’t just historical trivia. They’re a free (okay,
emotionally expensive) masterclass in risk.
1. A “Balanced” Portfolio Can Still Lose 20%+
If you hold a 60/40 portfolio, you must be emotionally prepared for occasional double-digit
drawdowns. History shows that losses in the range of 15–25% are possible in
extreme years.
That means:
- Don’t invest money you absolutely need in the next couple of years.
- Don’t build a retirement plan that collapses if your balance dips sharply in a single year.
- Do think in terms of decades, not quarters.
2. Time Horizon Is Your Real Superpower
Across long periods 20, 30, 40 years the 60/40 portfolio has historically delivered
attractive risk-adjusted returns. Studies from CFA Institute and other
researchers show that investors who stayed the course through wars, depressions, inflationary
shocks, and financial crises still enjoyed solid real growth of their capital.
The investors who suffered most were often the ones who abandoned their strategy at the worst
possible moment selling after a bad year because it “felt different this time.”
3. Diversification Is a Process, Not a Fixed Formula
The basic 60/40 mix is just one expression of diversification. After a year like 2022, many
institutional investors re-examined how they diversify risks:
- Adding real assets (infrastructure, real estate, commodities) that respond differently to inflation,
- Using shorter-duration bonds to reduce interest-rate sensitivity,
- Exploring alternatives like private credit or hedge fund strategies, where appropriate.
The point isn’t to abandon 60/40; it’s to understand that risk never disappears.
It just changes shape, and smart portfolios adapt over time.
4. Behavior Beats Micro-Optimization
You can spend hours tweaking 58/42 versus 62/38, or whether to tilt slightly to small caps or
value stocks. None of that matters if you panic-sell after a bad year.
The real edge comes from:
- Having a written plan,
- Rebalancing systematically (selling what’s done well, buying what’s lagged),
- Keeping fees and taxes low, and
- Sticking with your allocation through both boring years and terrifying ones.
As the title “A Wealth of Common Sense” suggests, successful investing isn’t about genius-level
forecasts. It’s mostly about not doing anything too dramatic when you’re stressed.
Experiences From the Worst 60/40 Years
It’s one thing to read numbers on a chart; it’s another to live through a “worst ever” year for
your portfolio. While every investor’s story is unique, certain patterns show up in how people
experience these painful episodes.
Living Through 2022: “I Thought Diversification Was Broken”
Consider a long-term investor nearing retirement in early 2022. They’d spent decades hearing
that a 60/40 portfolio was the sensible, grown-up choice tailor-made to reduce risk as they
approached the point where they’d live off their savings.
By mid-2022, their experience looked like this:
- Their stock allocation was dropping as growth stocks and broad indexes fell.
- Their bond funds, which were supposed to be the “ballast,” were also losing money as yields jumped.
- News headlines loudly declared the “worst bond market in modern history” and questioned the future of balanced portfolios.
Emotionally, it felt like the rulebook had been shredded. Many investors asked their advisors a
version of the same question: “If both stocks and bonds can go down this much at the same time,
what’s the point of diversifying?”
Advisors who guided clients successfully through 2022 often did a few key things:
- They showed long-term data on 60/40 drawdowns including 1931, 1937, the 1970s, and 2008 to prove that bad years weren’t unprecedented.
- They mapped out what would need to happen over the next 5–10 years for clients to still hit their goals, even starting from a lower portfolio value.
- They used the selloff to rebalance into cheaper assets buying more stocks and longer-term bonds at more attractive expected returns.
Then, as often happens, the part that was hardest to believe in the moment actually showed up:
the recovery. In 2023 and 2024, that same 60/40 allocation bounced back with strong double-digit
gains. Investors who stayed invested captured the upswing; those who bailed out often locked in
their 2022 losses and then struggled with when to get back in.
Earlier Generations: Surviving the 1970s and the GFC
Older investors who lived through the 1970s and 2008 often have a different perspective on
60/40 pain. Many remember:
- The slow grind of the 1970s, when inflation made even modest nominal returns feel like losses.
- The sheer fear of 2008, when nightly news segments featured failing banks and emergency government interventions.
For them, 2022 was shocking especially on the bond side but not entirely new. Their lived
experience reinforces what the data says: bad years hurt, but they don’t last forever, and
diversified portfolios have historically come back stronger on the other side.
What These Experiences Teach
Across eras, a few themes keep recurring in real-world 60/40 experiences:
- Expect discomfort. If a diversified portfolio never felt scary, it probably
wouldn’t earn much. Risk and reward are still linked. - Context is everything. A single bad year feels like the end of the world while
you’re in it. On a 40-year chart, it’s a noticeable dip not the main story. - Simple beats clever during crises. The investors who fared best often weren’t
the ones with the fanciest models, but the ones who stuck with a simple, sensible allocation and
rebalanced on schedule. - Planning trumps prediction. Nobody in 2019 had “global pandemic plus inflation
shock plus rate spike” at the top of their forecast list. The people who did well weren’t the
best predictors; they were the best planners.
In that sense, the worst years for a 60/40 portfolio are not just scary chapters they’re the
tuition you pay for owning an asset mix that has historically provided a very reasonable balance
of growth and stability over a lifetime.
Final Thoughts: A Wealth of Common Sense, Indeed
The phrase “A Wealth of Common Sense” captures the ultimate message of the
60/40 story perfectly. The worst years ever for this classic balanced portfolio 1931, 1937,
the 1970s, 2008, 2022 are scary, but not fatal, for investors with patience, diversification,
and a realistic plan.
A 60/40 portfolio will not protect you from every storm, and it will occasionally deliver a year
that makes you question your life choices. But judged over decades, not months, it has provided
a remarkably resilient path to compounding wealth one that’s simple enough to follow and
robust enough to survive some of the worst markets in history.
That’s not a magic trick. It’s just common sense, backed by a lot of data and a lot of very
patient investors.